PROFILING
THE GLOBAL
INNOVATION 1000
Amid
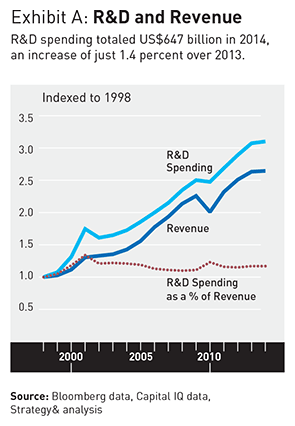
an unsettled world outlook, R&D spending among the Global
Innovation 1000 totaled US$647 billion in 2014, just 1.4 percent more
than in the previous year. This is the second year in a row of
below-average growth, following unusually strong (about 10 percent)
gains in 2011 and 2012 as innovation spending bounced back after the
financial crisis. Revenues for the Global Innovation 1000, meanwhile,
increased by a solid 3.7 percent (to $18.4 trillion) in 2014. As a
result, R&D intensity—innovation spending as a percentage of
revenue—fell slightly to 3.5 percent, close to its long-term
average (see
Exhibit A).
The
slow growth in total innovation spending for 2014 is a big-company
phenomenon: The top 100 innovation spenders accounted for less than 1
percent of the 2014 increase in R&D spending, compared with 45
percent the previous year. Yet despite the slowdown among the 100
largest, overall, nearly 60 percent of the companies that were also
on the list in 2013 increased their R&D spending. (Calculations
are based on companies’ reported R&D spending in the last
fiscal year, as of June 30, 2014. For more details, see
“Methodology”.)
Although
big companies scaled back their rate of R&D spending growth, they
still accounted for the lion’s share of total R&D
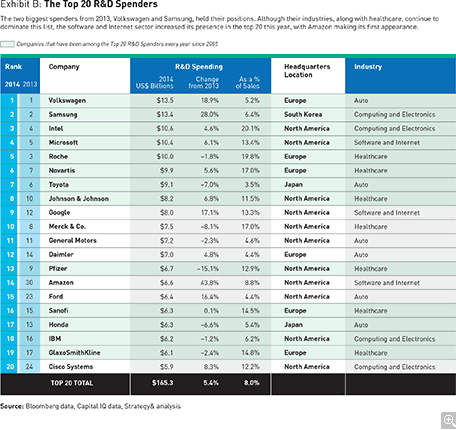
spending. The top 20 companies, in fact, accounted for more than 25
percent of the total in 2014. Several newcomers joined the ranks of
the top 20, including Amazon (at number 14), Ford (number 15), and
Cisco (number 20) (see
Exhibit B).
Overall, however, the top 20 list has remained fairly consistent over
the 10 years that we’ve analyzed the Global Innovation 1000.
Thirteen companies have been listed every year: GlaxoSmithKline,
Honda, IBM, Intel, Johnson & Johnson, Microsoft, Novartis,
Pfizer, Roche, Samsung, Sanofi, Toyota, and Volkswagen.
The
slowdown in total innovation spending growth for 2014 reflects
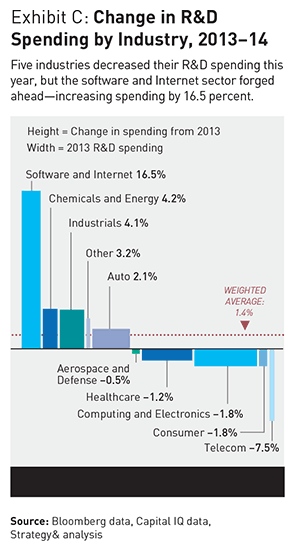
declines in five of the nine industries we track. Although R&D
spending fell less than 2 percent in the aerospace and defense,
healthcare, computing and electronics, and consumer sectors, these
cutbacks are particularly notable because the four sectors’
spending represents 53 percent of total Global Innovation 1000 R&D
spending. The telecom sector posted the steepest decline, dropping
7.5 percent. This was a continuation from 2013, when telecom R&D
spending was down 2.2 percent. Pricing pressures, combined with the
need for increased capital expenditures to update networks to the
latest technologies, likely led telecom companies to shift investment
away from R&D. Innovation spending was up modestly in the
chemicals and energy, industrials, and auto sectors, with the biggest
increase—a solid 16.5 percent gain—in the software and Internet
sector (see
Exhibit C).
At
nearly 12 percent, that sector has had the highest compound average
growth in R&D spending over the 10-year history of the Global
Innovation 1000 study—boosted significantly by double-digit
increases in each of the last three years. This is not surprising,
given the dynamism of the industry. What may be surprising, however,
is that the chemicals and energy sector and the industrials sector
had the second- and third-highest rates of growth, respectively, both
in 2014 and over the last 10 years.
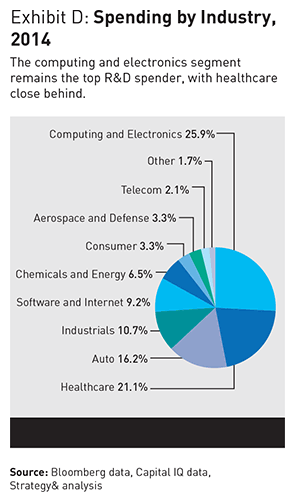
Despite
the impressive growth of innovation spending in the software and
Internet category, four other industries spent more absolute dollars
on R&D in 2014: computing and electronics, healthcare, auto, and
industrials (see
Exhibit D).
In fact, three of them—computing and electronics, healthcare, and
auto—have spent more on R&D than the software and Internet
industry in each of the last 10 years. This shows that there has been
and continues to be a huge amount of innovation spending going on
outside Silicon Valley and other tech clusters.
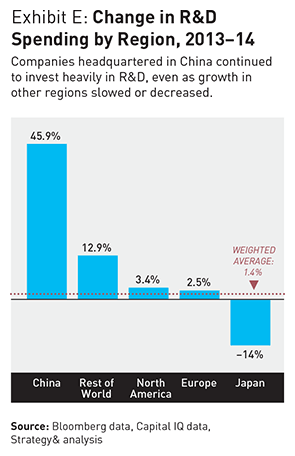
Looking
at the regional data, R&D spending growth in 2014 has slowed in
both North America (a 3.4 percent increase) and Europe (2.5 percent)
(see
Exhibit E).
Japan, meanwhile, continues to retrench. R&D spending was down 14
percent for Japanese companies in 2014, following a 3.4 percent
decline in 2013. Innovation spending in the rest of the world, a
category that includes Brazil and India, rose by a solid 12.9
percent, but that also represents a slowdown from the 13.7 percent
increase in 2013. The clear exception to 2014’s generally downbeat
trend was China, where R&D spending was up an impressive 45.9
percent—a further acceleration from the 34.4 percent rate of
increase in 2013. (For a closer look at China’s continuing rise as
an innovation power, see “China’s
Innovation Engine,”
by John Jullens and Steven Veldhoen.)
The
story in 2014 may be one of slower growth, despite a few standouts,
but the story of the last 10 years is one of sustained investment.
Even at the depth of the Great Recession, spending contracted only
modestly, far less than the decreases in capital expenditures or
revenues. In fact, the level of spending needed for a company to be
included in the Global Innovation 1000 has more than doubled, from
$37 million in 2005 to $83 million in 2014. And the amount of
spending needed to break into the top 20 list has grown by 46
percent—from $4.1 billion in 2005 to $5.9 billion in 2014.
- Barry Jaruzelski, Volker Staack and Brad Goehle
- Also contributing to this article were s+b contributing editor Rob Norton, and Strategy& senior campaign manager Josselyn Simpson, senior analyst Jennifer Ding, and campaign manager Kristen Esfahanian.
No comments:
Post a Comment